In this blog, you’ll learn what jaeger distributed tracing is, how to set it up in your system and explore how it can help you to gain insights about your application’s performance.
Overview:
Jaeger is a distributed tracing system and it is one of the most popular Open source software that developed by Uber technologies and is now part of the Cloud Native Computing Foundation (CNCF).
In the world of microservice architectures, most issues occur due to networking issues to resolve these issues we need to see which service sent what paramaters to another service. So that Jaeger provides essential features for tracing requests in microservices based architecture. By doing so, it provides a detailed view of how these services interact and impact overall application performance.
What is distributed tracing?
It is a technique to monitor and visualize the flow of requests and understand the whole chain of events in a complex interaction between microservices. For example, we have microservice based application running on our system, we need a way to track all of the interactions. That’s where distributed tracing comes in. It allows developers and operation teams to identify the latency issues and error sources within the system. It helps us with detailed view of how a requests flows through the entire application.
What is OpenTelemetry?
OpenTelemetry is an open-source project that is rapidly becoming the industry standard for observability in modern software development. It helps organizations by providing a set of APIs, libraries, agents, and instrumentation to standardize and simplify the collection of observability data in cloud-native environments. And makes it easier to generate, collect, and export metrics and traces from your applications, allowing you to gain insights into their performance. Also it allows you to trace requests across microservices, containers, and cloud environments providing end-to-end visibility into your applications. It has broad industry support and can seamlessly integrate with a wide range of observability tools and platforms.
Architecture of Jaeger:
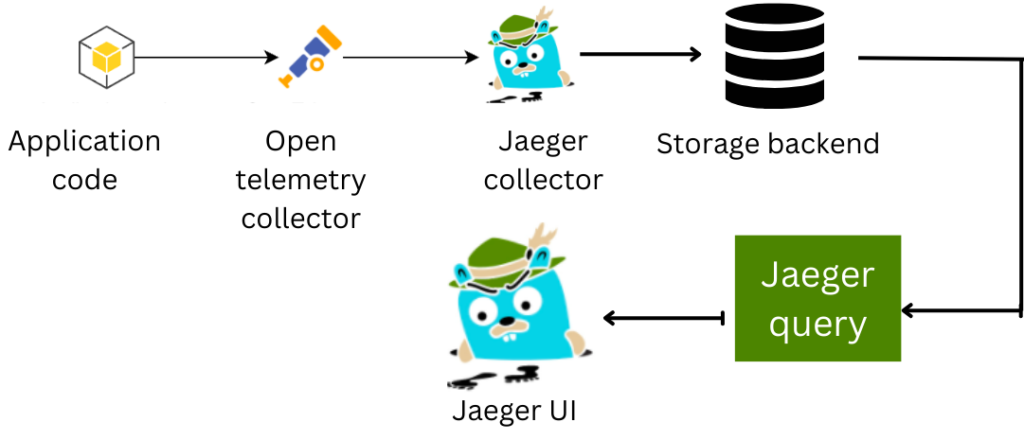
Components of Jaeger:
-
- Jaeger Client: The Jaeger clients are libraries written in various programming languages, and are responsible for span creation.
-
- Jaeger Agent: Jaeger agent is a lightweight daemons that run alongside your application components. They collect trace data generated by the instrumentation and send it to the jaeger collector.
-
- Jaeger Collector: The collector is responsible for receiving, processing and storing trace data from the agents. After that, it stores them in a chosen backend, such as elasticsearch and so on.
-
- Jaeger Query: The query service provides a user-friendly web-based interface for searching and visualizing traces. It allows users to explore the trace data collected from their applications.
Key Features of Jaeger:
Here are some key features of jaeger:
-
- Instrumentation Support: Jaeger offers libraries and software development kits (SDKs) for popular programming languages, including Java, Python, Go and more. This allows developers to easily instrument their code to generate trace data.
-
- Agent-Collector: Jaeger employs an agent-collector architecture, where lightweight agents are deployed alongside application components to collect trace data. This data is then forwarded to a central collector for processing.
-
- Rich Visualization: Jaeger provides a user-friendly web-based interface for visualizing trace data. Users can search for specific traces, inspect individual spans (representing units of work within a trace), and analyze performance bottlenecks.
-
- End-to-End Tracing: In a distributed system with multiple services, tracing allows you to follow a single request’s journey across all components. Without instrumentation, you would only see individual service-level metrics, making it challenging to understand the end-to-end behavior of your application.
- Integrations: Jaeger seamlessly integrates with other observability tools and data stores like Elasticsearch, Prometheus, and Grafana, allowing for a more comprehensive monitoring and troubleshooting stack.
we will see how to trace and instrument your applications with OpenTelemetry and Jaeger.
Implementing Tracing with Jaeger:
Installation and Setup:
Jaeger provides clear and easy to follow installation documentation for various platforms and strategies. You can use https://www.jaegertracing.io them to install.
Instrumenting Your Application Code:
To begin with tracing your application, the first step towards distributed tracing is application code it must be instrumented. It generates trace data that helps us monitor the performance of an application. It allows us to track the requests from various components such as databases, microservices and so on.
-
- kubectl create namespace observability
-
- kubectl create -n observability -f https://raw.githubusercontent.com/jaegertracing/jaeger-operator/main/deploy/service_account.yaml
-
- kubectl create -n observability -f https://raw.githubusercontent.com/jaegertracing/jaeger-operator/main/deploy/role.yaml
-
- kubectl create -n observability -f https://raw.githubusercontent.com/jaegertracing/jaeger-operator/main/deploy/role_binding.yaml
- kubectl create -n observability -f https://raw.githubusercontent.com/jaegertracing/jaeger-operator/main/deploy/operator.yaml
In our project, once our code is instrumented such as Python, Go and NodeJs. We have deployed that instrumented code and to create jaeger instance using Production jaeger strategy. The production strategy is intended (as the name suggests) for production environments, where long term storage of trace data is important, as well as a more scalable and highly available architecture is required. And Jaeger will begin collecting trace data as requests flow through application.
Integrate with Elasticsearch:
Configure jaeger to use elasticsearch as its storage backend. You can edit this yaml file to match your requirements.

We have deployed an Elasticsearch version 7.x because currently that is the only version is supported with jaeger to store our trace data. Also configured jaeger collector to trace data into elasticsearch. They are stored in elasticsearch for analysis.
Visualizing traces in Jaeger UI:
In the Jaeger UI, we can now browse the traces and will see something like this.
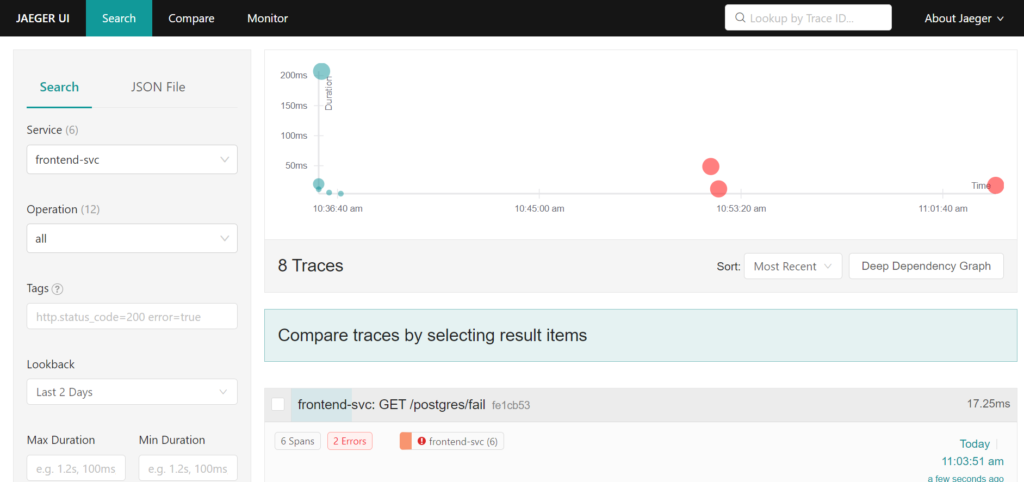
We can visualize these trace data using Jaeger UI. Access the jaeger dashboard to search for traces, view detailed information about spans and identify root cause of the error. With trace data we can analyze the performance of our project. And identifying parts where requests are slow or troubleshooting the issues.
Trace data gives us to trace the complete request flow, where error occurred and quickly identify the root causes. It makes debugging much more efficient and less time consuming. Also it helps us with the visibility, monitoring, troubleshooting and deep insights to maintain good quality application.

Clicking on one of the elements of the trace, we can expand it and view all the tags.

-
- It shows a trace timeline for a request and the duration of each span in the trace.
-
- And it shows a breakdown of how long it took for the service to process a request.
-
- The trace timeline shows that the request took 17.25ms to process.
-
- The breakdown shows the different parts of the request and how long each part took.
-
- The tag section in UI provides additional information about traces and it can be used to filter and identify all traces that from particular query.
-
- This information can be used to identify and troubleshoot performance problems.
Conclusion:
With the help of Jaeger, we spot the issues easily where things went wrong, whether it’s error, slowdown or something else. And It helps us to follow the request flow through our project, so that we can see what’s happening on every service. By identifying and resolving issues fast, we can ensure it runs smoothly. It makes easier to find and fix issues. By instrumenting our code, collecting trace data and visualizing it through Jaeger interface.