Maximizing Monitoring and Visualization with Grafana in Kubernetes
Kubernetes has brought about a significant transformation in how we deploy and manage applications. However, the key to ensuring their reliability and performance hinges on effective monitoring and visualization. An indispensable tool in this endeavor is Grafana, an open-source platform renowned for its capacity to convert data into actionable insights. In this comprehensive guide, we will explore the world of Grafana and how it can supercharge your Kubernetes monitoring endeavors.
Introduction
What is Grafana?
Grafana is a versatile and potent open-source platform designed for monitoring and observability. It offers a unified approach to visualize and analyze data from diverse sources, making it an ideal choice for monitoring Kubernetes clusters.
Key Features
Data Source Agnosticism: Grafana can seamlessly connect to a wide array of data sources, including Prometheus, InfluxDB, Elasticsearch, and more, granting you the flexibility to gather and visualize data from a variety of systems.
Interactive Dashboards: Craft interactive and adaptable dashboards displaying real-time data, facilitating swift decision-making and issue resolution.
Alerting and Notifications: Configure alerts based on predefined thresholds and receive notifications through email, Slack, or other channels when issues arise.
Installing and Configuring Grafana in Kubernetes
Installation Methods
Learn the ropes of deploying Grafana in your Kubernetes environment using Helm charts or manual resource configuration. Ensure seamless integration of Grafana with Prometheus for a unified monitoring solution.
Data Source Configuration
Walk through the process of configuring Prometheus as a data source in Grafana. This step is pivotal for Grafana to access the trove of metrics collected by Prometheus within your Kubernetes cluster.
Creating Custom Dashboards
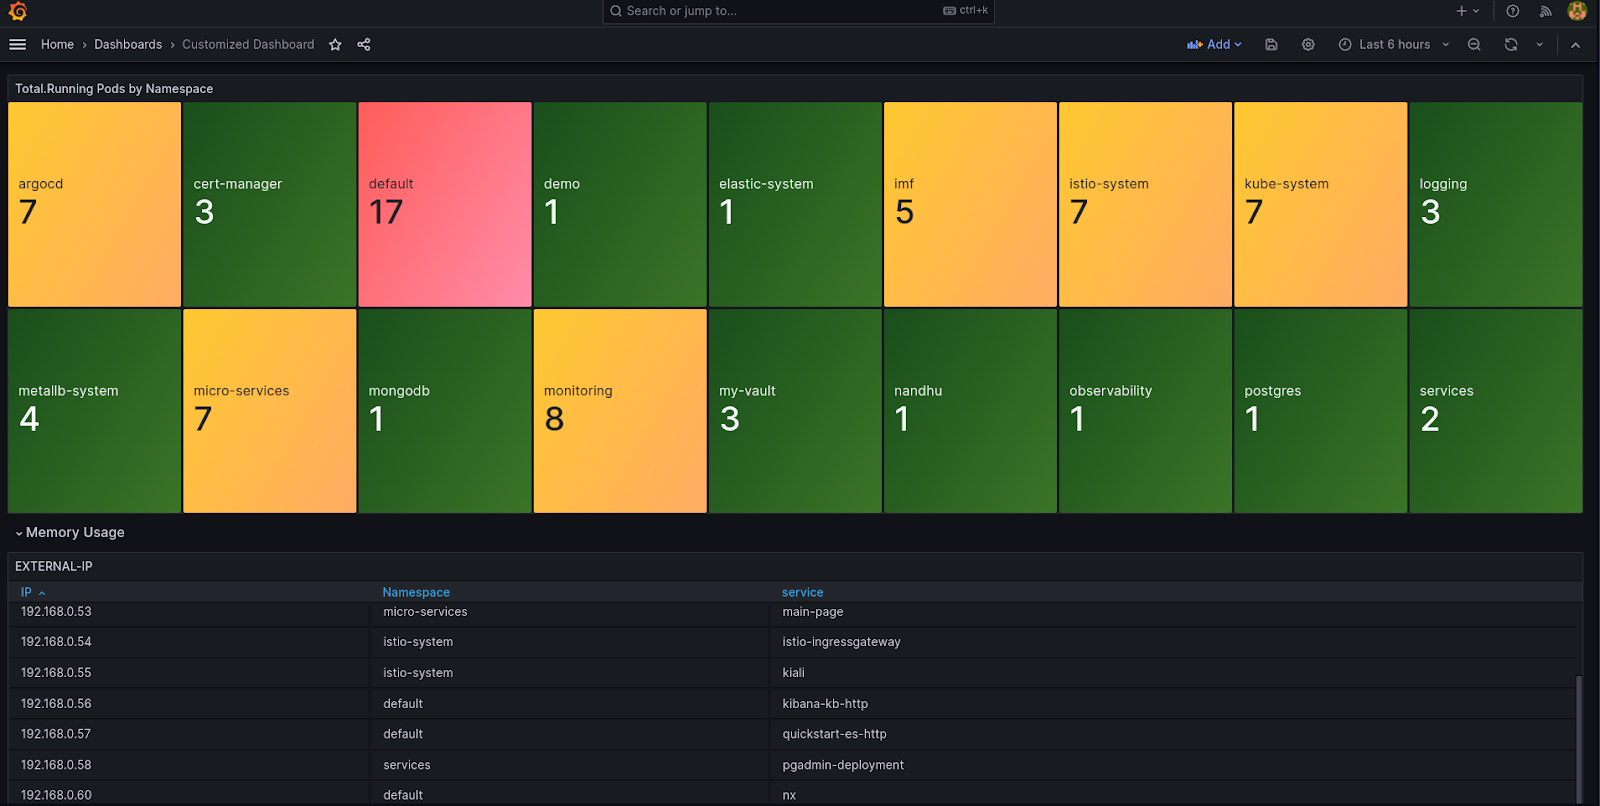
Learn how to design custom dashboards tailored to the specific needs of your application and infrastructure. Leverage Grafana’s user-friendly interface to construct informative and actionable dashboards.
Advanced Grafana Usage in Kubernetes
Templating and Variables
Dive into Grafana’s templating and variable features to make your dashboards dynamic and adaptable to different Kubernetes clusters, namespaces, or applications.
Plugins and Extensibility
Acquire the knowledge of extending Grafana’s capabilities with plugins, enabling integration with additional data sources, visualization options, and alerting methods.
Best Practices for Effective Kubernetes Monitoring
Scalability and High Availability
Explore the best practices for scaling Grafana within your Kubernetes environment and ensuring high availability to eliminate single points of failure.
Optimizing Query Performance
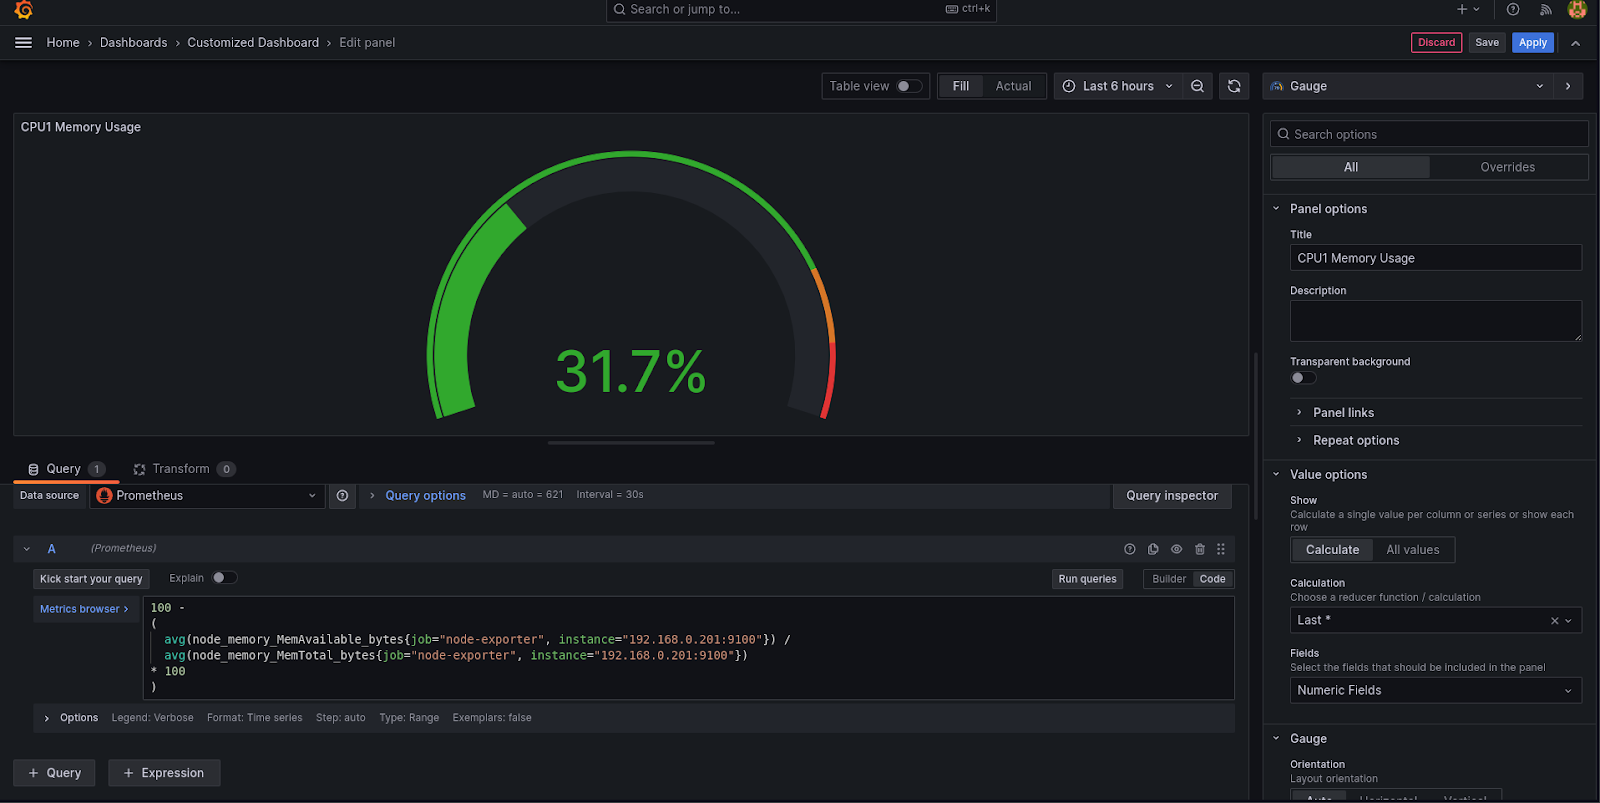
Fine-tune your PromQL queries to maximize the efficiency of data retrieval and visualization in Grafana.
Real-World Use Cases
Delve into real-world examples showcasing how organizations have harnessed Grafana to monitor and visualize their Kubernetes environments effectively.
Conclusion
Grafana is an indispensable asset in your Kubernetes monitoring toolkit, offering the capability to transform raw data into actionable insights. With the right setup and configuration, you can unlock its full potential to ensure the reliability, performance, and scalability of your Kubernetes applications.
Whether you are embarking on your Kubernetes monitoring journey or aiming to enhance your existing setup, Grafana serves as the key to visualizing your data and taking control of your infrastructure.
This article delivers an all-encompassing overview of Grafana’s role in Kubernetes monitoring, spanning from installation to advanced usage and best practices. If you have specific questions or require further information on any of these subjects, please don’t hesitate to reach out.