Mastering Kubernetes Monitoring with Prometheus: A Comprehensive Guide
Introduction
Prometheus is an open-source monitoring and alerting system designed to provide comprehensive insights into the performance and health of your Kubernetes clusters and applications. In this comprehensive guide, we’ll explore how Prometheus works and its key components.
Section 1: Understanding Prometheus
1.1. Installation
Installing Prometheus within your Kubernetes cluster can be approached in multiple ways. We offer two primary methods:
- Helm Chart: We can set up Prometheus using the official Prometheus Helm chart, which simplifies the deployment process and ensures you have a standardized configuration.
- Manual Configuration: For more granular control, we can manually configure Kubernetes resources such as ConfigMaps, Services, and Deployments tailored to your specific requirements. This approach allows for customization and fine-tuning of Prometheus settings.
1.2. Configuration
Configuring Prometheus is a critical step in harnessing its monitoring capabilities. Our team of experts will assist you in this process, which involves:
- Scrape Targets: Defining scrape targets is essential for instructing Prometheus on what data to collect. These targets often include Kubernetes pods and services that host your applications. Prometheus periodically scrapes these targets to gather metrics.
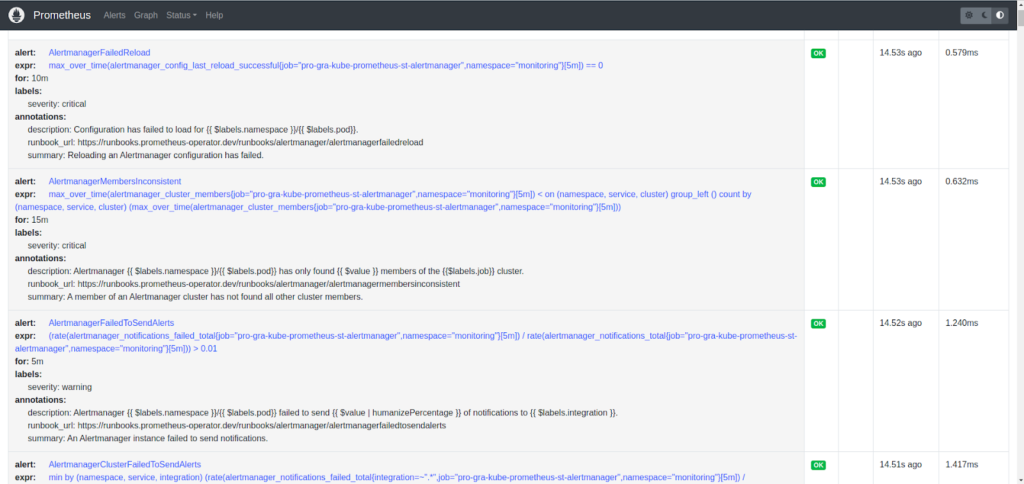
- Alerting Rules: We help you set up alerting rules to proactively identify issues. When predefined conditions are met, Prometheus triggers alerts, allowing you to respond swiftly to potential problems.
- Storage Backends: Prometheus stores data locally by default. However, for long-term data retention and scalability, we can configure Prometheus to use its remote_write feature to send data to remote storage solutions.
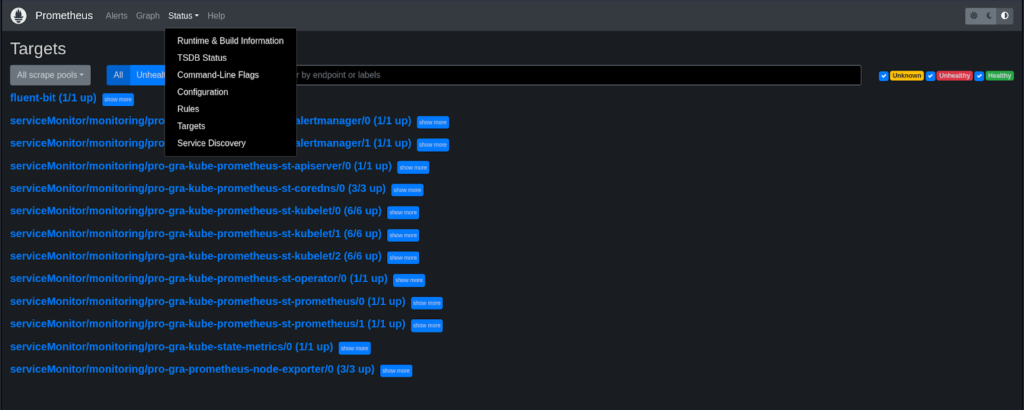
- ServiceDiscovery: Dynamic target discovery through Kubernetes ServiceDiscovery simplifies the configuration process. This means that as your Kubernetes environment evolves, Prometheus can automatically adapt to new targets.
Section 2: Monitoring Kubernetes with Prometheus
With Prometheus integrated into your environment, let’s delve into how it provides comprehensive monitoring for your Kubernetes cluster
2.1. Node and Pod Metrics
Prometheus continuously monitors the performance of your Kubernetes nodes and pods. This includes tracking crucial metrics such as:
- CPU Usage: Measuring CPU utilization helps ensure efficient resource allocation.
- Memory Usage: Monitoring memory consumption is vital for identifying potential bottlenecks.
- Network Traffic: Tracking network traffic provides insights into communication patterns.
- Disk Usage: Monitoring disk space prevents potential storage issues.
We establish alerts based on these metrics to proactively notify you of any performance anomalies or resource constraints.
2.2. Application Metrics
In addition to infrastructure metrics, we assist you in instrumenting your applications to expose custom metrics. Prometheus can scrape these metrics, providing valuable insights into:
- Application Health: Metrics related to request latency, error rates, and service availability.
- Resource Utilization: Tracking resource consumption at the application level.
- Custom Business Metrics: Collecting and visualizing business-specific KPIs.
These custom metrics empower you to make data-driven decisions to optimize your application’s performance and reliability.
2.3. Alerts and Notifications

Our experts configure alerts in Prometheus to identify issues early on. When Prometheus detects anomalies or breaches of predefined thresholds, it triggers alerts. To manage and visualize these alerts effectively, we integrate Prometheus with Grafana. Additionally, we set up notification channels such as Slack, email, or PagerDuty to ensure that the right personnel are informed promptly, enabling swift responses to critical events.
Section 3: Best Practices and Advanced Tips
To maximize the effectiveness of Prometheus in your Kubernetes monitoring solution, we follow advanced best practices:
3.1. Scalability
Our solution is designed to scale seamlessly with your Kubernetes cluster’s growing demands. We implement horizontal scaling for Prometheus and Grafana components, ensuring they can handle increased workloads efficiently. This scalability is crucial as your applications and infrastructure evolve over time.
3.3. Resource Monitoring
Our monitoring extends beyond application and infrastructure metrics to cover resource consumption by Kubernetes itself. We continuously track critical components such as etcd, control plane elements, and kubelet metrics. This comprehensive approach ensures the overall health and stability of your Kubernetes cluster.
3.4. Continuous Improvement
Monitoring needs evolve as your applications and infrastructure change. To keep your monitoring setup aligned with your evolving requirements, we conduct regular reviews and updates. This includes adjustments to alerting rules and dashboards to reflect changes in your applications and infrastructure. Continuous improvement ensures that your monitoring solution remains effective and valuable over time.
Conclusion
In conclusion, mastering Kubernetes monitoring with Prometheus is a critical step in ensuring the reliability, performance, and health of your applications and infrastructure. This comprehensive guide has equipped you with the knowledge and best practices needed to harness Prometheus’s capabilities fully. From installation and configuration to advanced tips, you now have the tools to create a robust monitoring environment tailored to your specific Kubernetes needs. With Prometheus as your ally, you can navigate the complex world of Kubernetes with confidence, proactively addressing issues and optimizing performance.
This conclusion wraps up the guide by summarizing the importance of Prometheus in Kubernetes monitoring and the knowledge gained throughout the article.