Let’s dive into the steps to configure Fluent Bit with a DaemonSet and ConfigMap.
Step 1: Deploy a Fluent Bit ConfigMap (Input, Output & Parser Configurations)
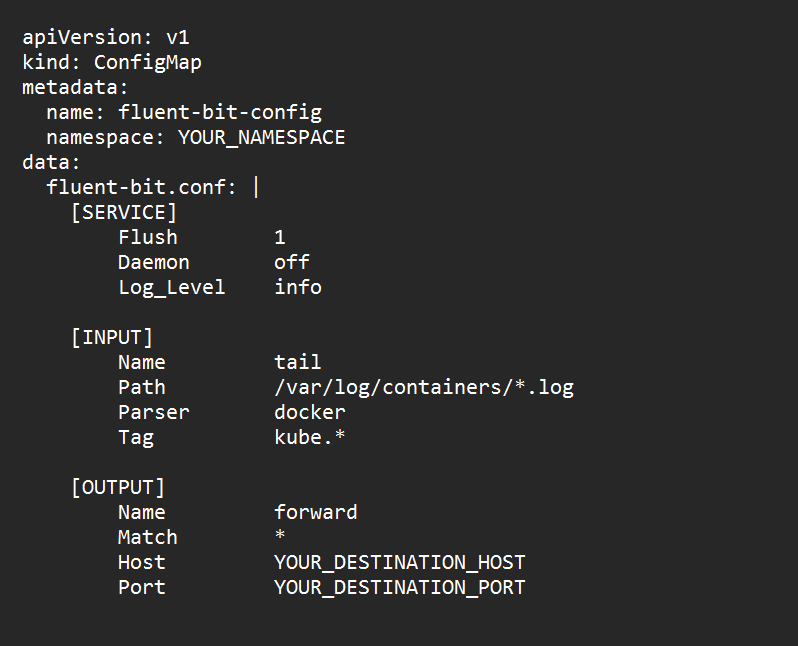
Edit this yaml file to match your requirements or you can use https://docs.fluentbit.io documentation for more details.
Step 2: Deploy a Fluent Bit DaemonSet
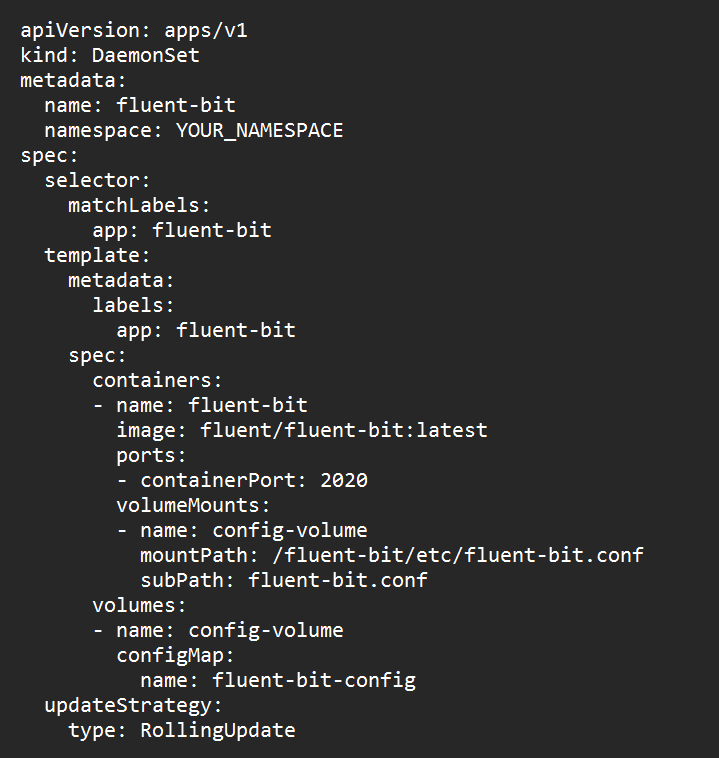
Replace the mountpath in the file before applying it. Then we have to ensure that Fluent Bit runs on each node in our kubernetes cluster.
Step 3: Apply the YAML files
kubectl apply -f fluent-bit-config.yaml
kubectl apply -f fluent-bit-daemonset.yaml
Step 4: Deploy an Elasticsearch & Kibana


Step 5: Verify Fluent Bit logs
Now, Monitor the Fluent Bit logs to ensure it’s collecting and forwarding logs as we expected.
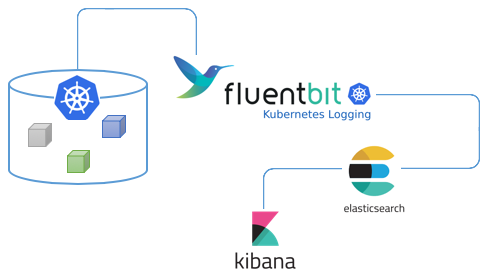
Architecture:
Discovering Logs in Kibana:
Access Kibana by using an URL with the following format:
https://<EXTERNAL-IP>:<PORT>
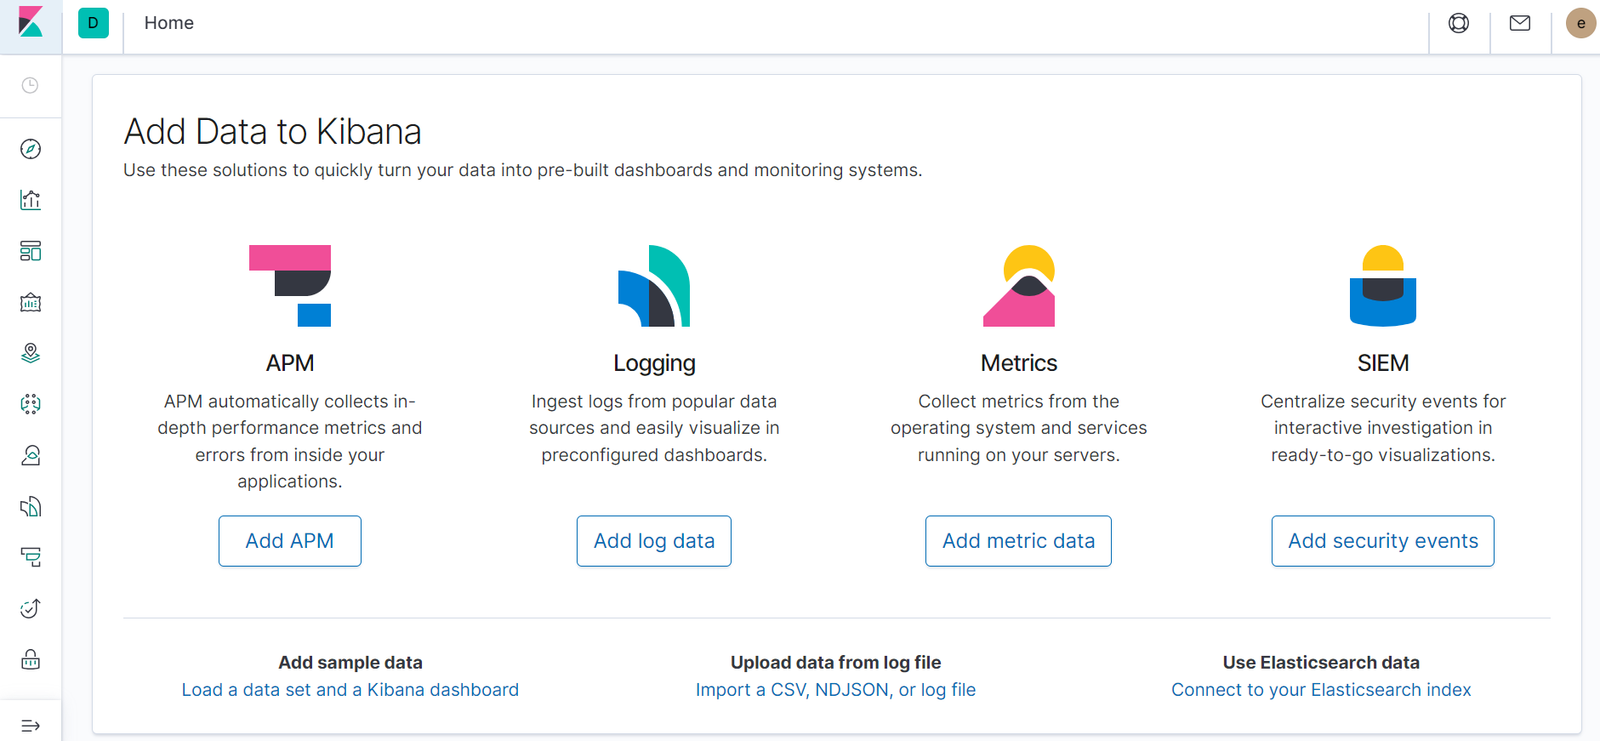
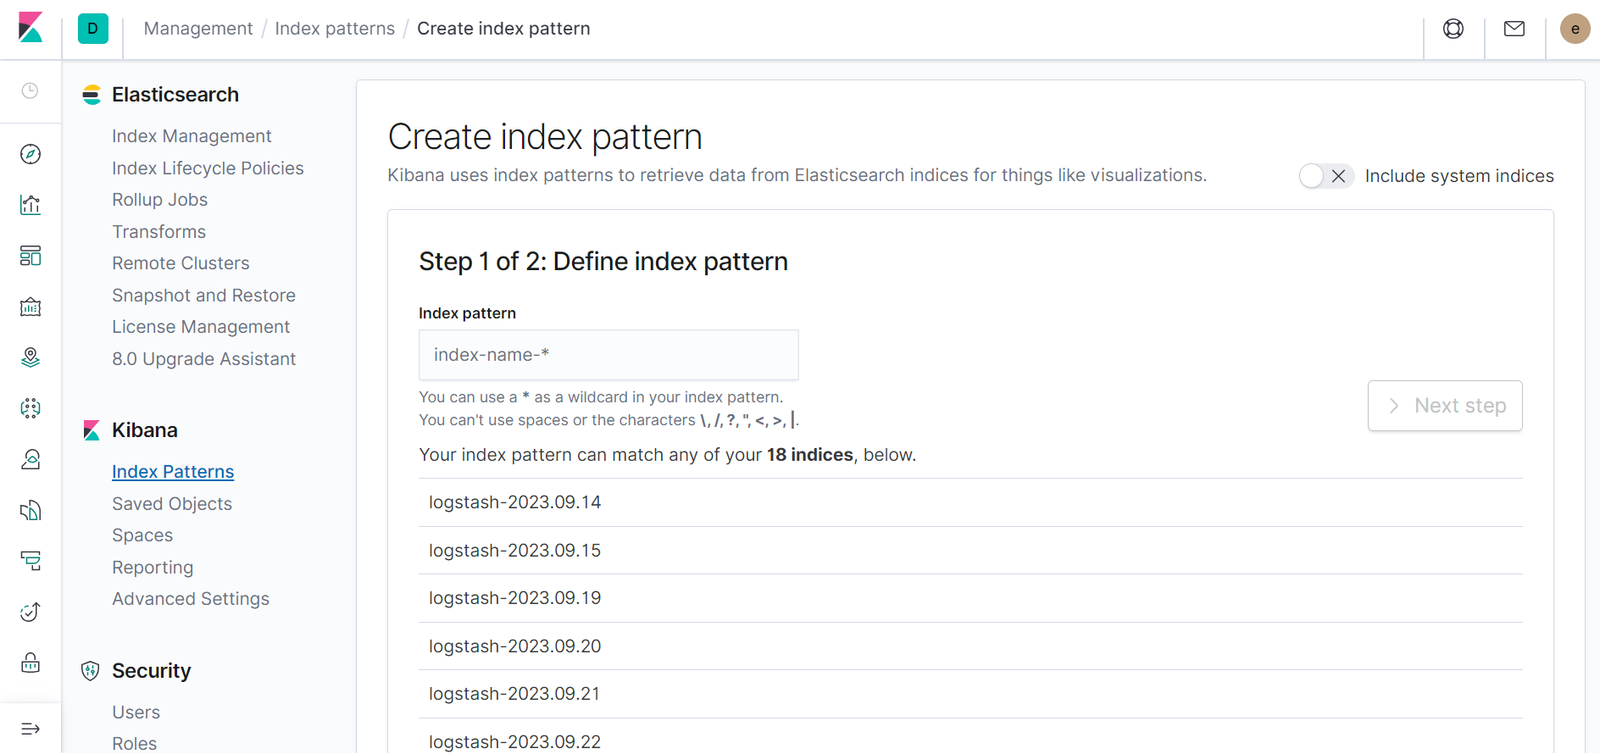
In index pattern, we will have to create an index as shown below. Click on Index Patterns> Create index pattern and click Next Step.
Once the index has been created. Navigate to the discover tab by clicking the discover icon to view if our logs are in place.
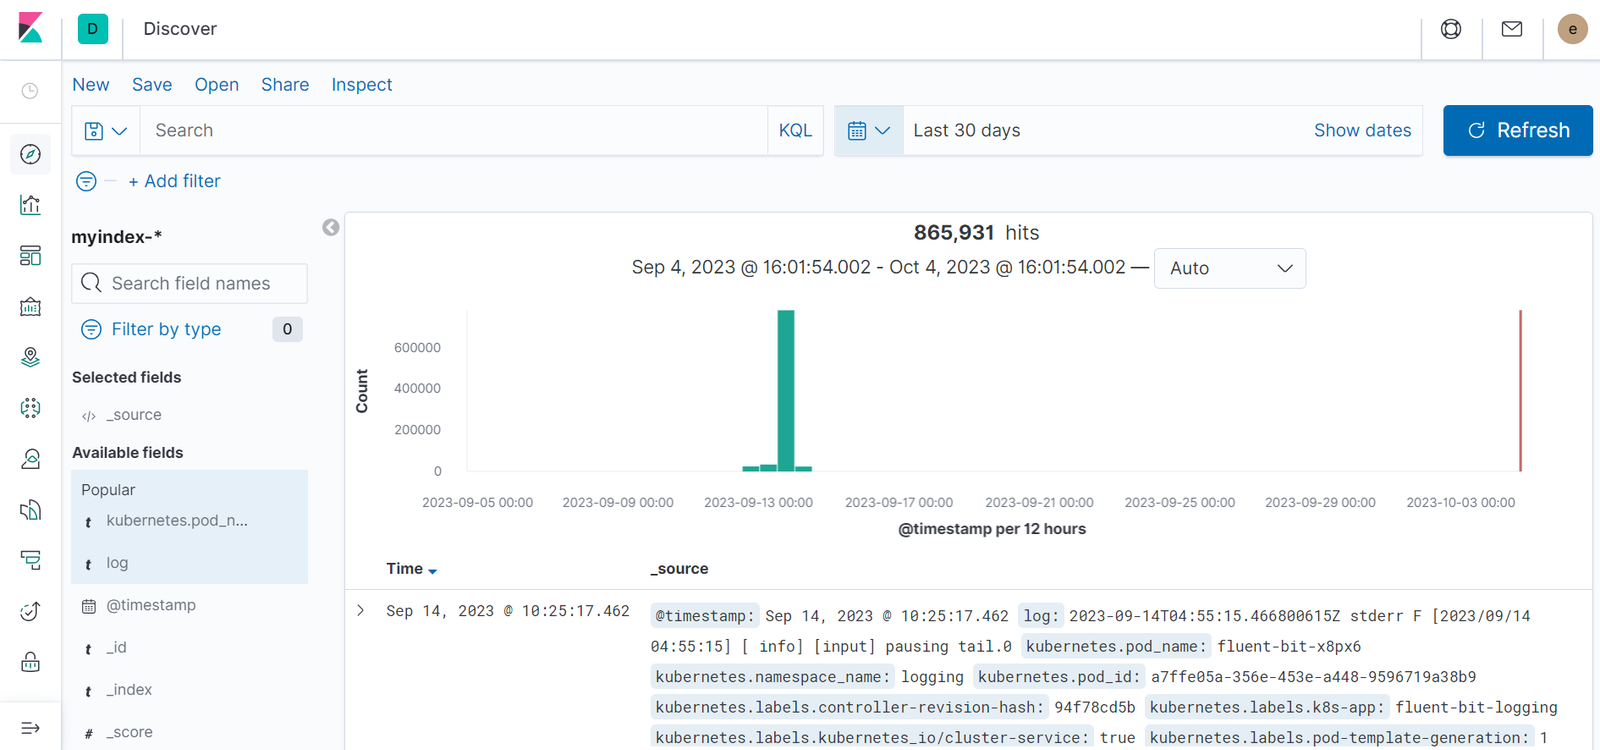
With kibana, we can use kubernetes logs and visualize them as we want using the capabilities of kibana and elasticsearch. And expand each log to view the details of the logs.
-
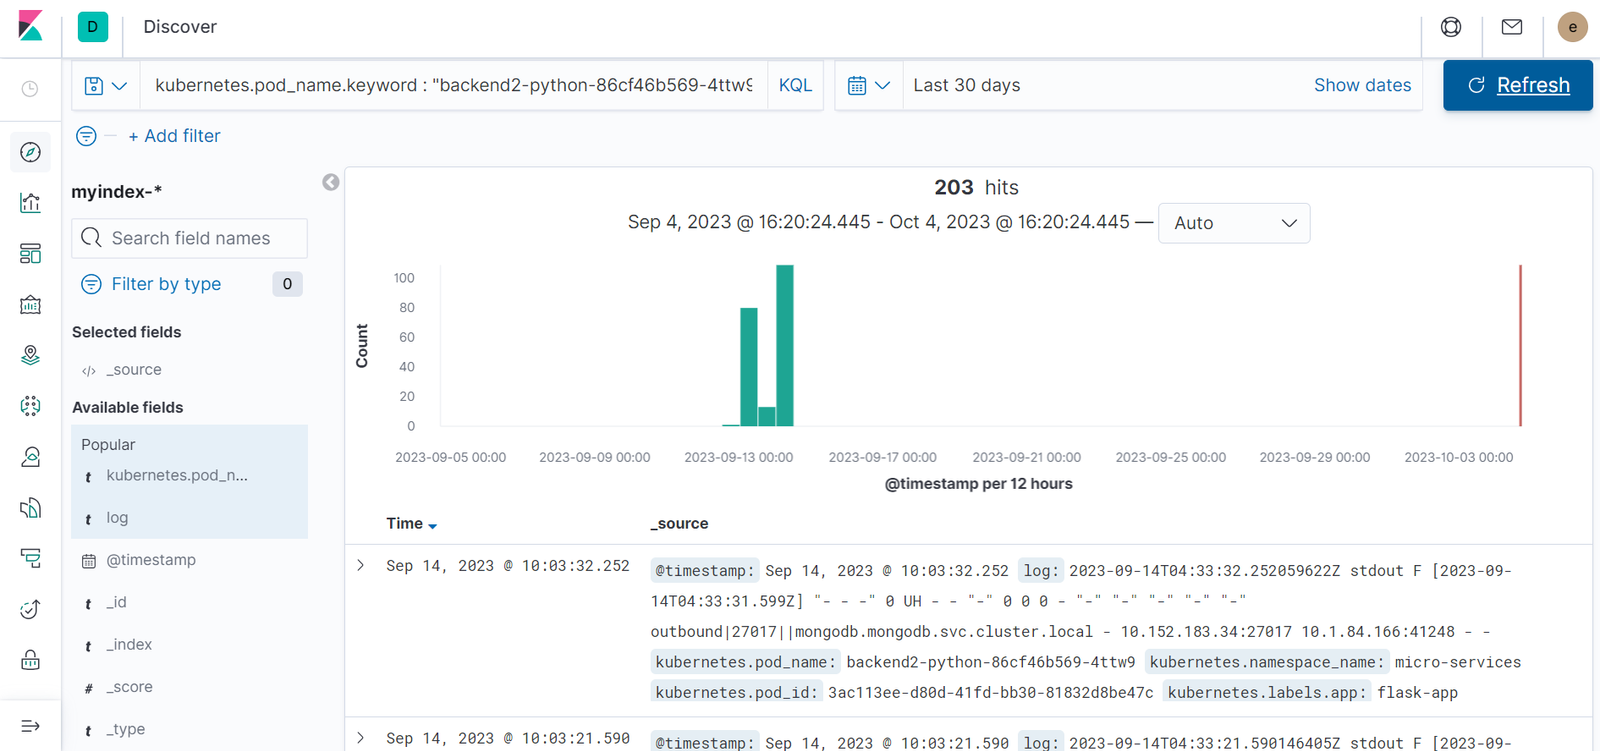
- This image shows the discover tab in Kibana, which is a tool for exploring and analyzing Elasticsearch data.
-
- The Discover tab is showing a table of data from the myindex-* index, with the kubernetes.pod_name field filtered to only show data for the pod backend2-python-86cf46b569-4ttw.
-
- The table is showing data for the last 30 days, and the time range is set to show dates.
-
- The graph shows the number of hits over time. The x-axis shows the date and time, and the y-axis shows the number of hits. The graph shows that there in hits on September 14, 2023.
-
- The table is sorted by the @timestamp field in descending order, which means that the most recent events are shown at the top of the table.
-
- This information can be used to monitor the health of the Kubernetes pod and to troubleshoot any problems that may occur.
Why does logging matter?
Because logs provide visibility and monitoring into the behavior of a running application. Eventually, every application may crash, a server will go down or users will get frustrated about a bug. If we have a good logging and monitoring infrastructure, the solution to these difficulties, logging is one of the most critical aspects of our applications. Therefore, we need to consider it carefully.
Prometheus Dashboard:
To use Fluent Bit with Prometheus, we need to configure Fluent Bit to forward its metrics to prometheus. To do this, add the following target to the Prometheus configuration file, edit this yaml file to match your requirements.
prometheus:
 prometheusSpec:
  additionalScrapeConfigs:
   - job_name: 'fluent-bit'
     static_configs:
      - targets: ['fluent-bit.logging.svc.cluster.local:2020']
Once you have added the Fluent Bit target to the Prometheus configuration file, you can start scraping the target. Then we can view the Fluent Bit metrics in the Prometheus Dashboard.
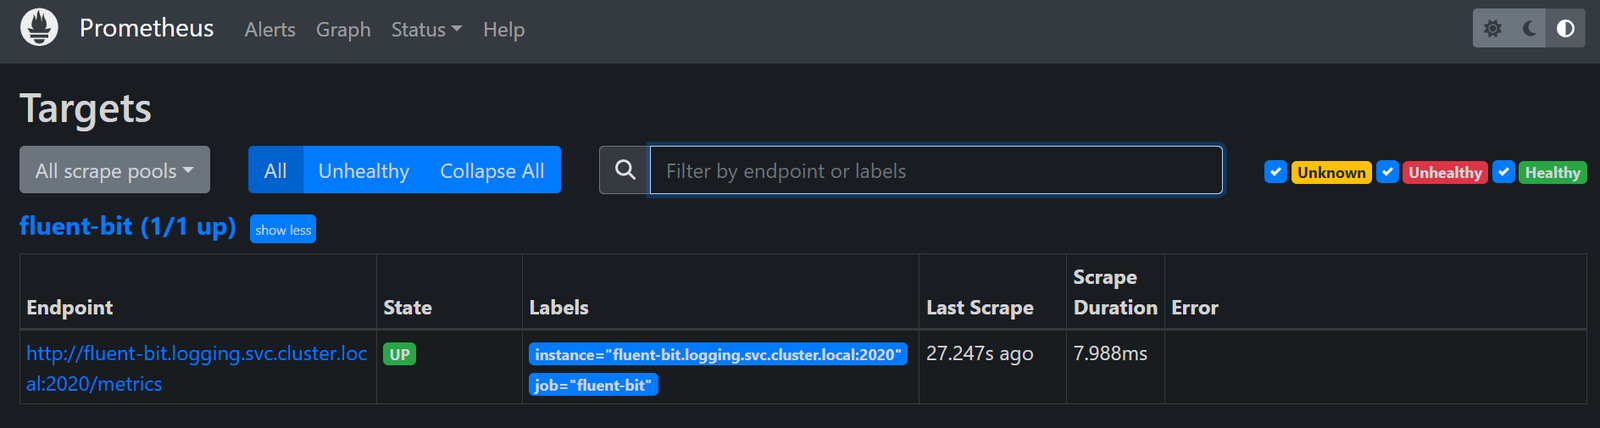
The Prometheus Dashboard shows a variety of metrics for Fluent Bit, including the scrape duration, scrape error, endpoint, state, and labels. We can use these metrics to monitor the health and performance of our Fluent Bit deployments.
Conclusion:
With Fluent Bit, We are able to view the logs in real time using the Fluent Bit and Prometheus Dashboard. Fluent Bit is helps us to collect logs from our applications, and Prometheus is used to monitor those logs. This allows us to quickly identify and resolve any problems with our application. Fluent Bit can parse log data, making it easier to extract valuable information from your logs. This allows us to track the performance of our application and identify any areas where we need to improve.
Overall, Fluent Bit and Prometheus have made it much easier for us to monitor our application and infrastructure in real time.